Quantifying the Info Gain from a Classifier
The goal for this section is to quantify the information gain of this model and compare it on an apples-to-apples basis to a hypothetical competing model.
Model Characteristics
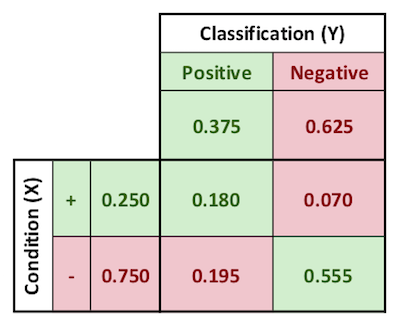
I previously established the following performance characteristics for this model:
$$\text{true positive count} = .150$$
$$\text{true positive rate} = .600$$
$$\text{positive predictive value} = .480$$
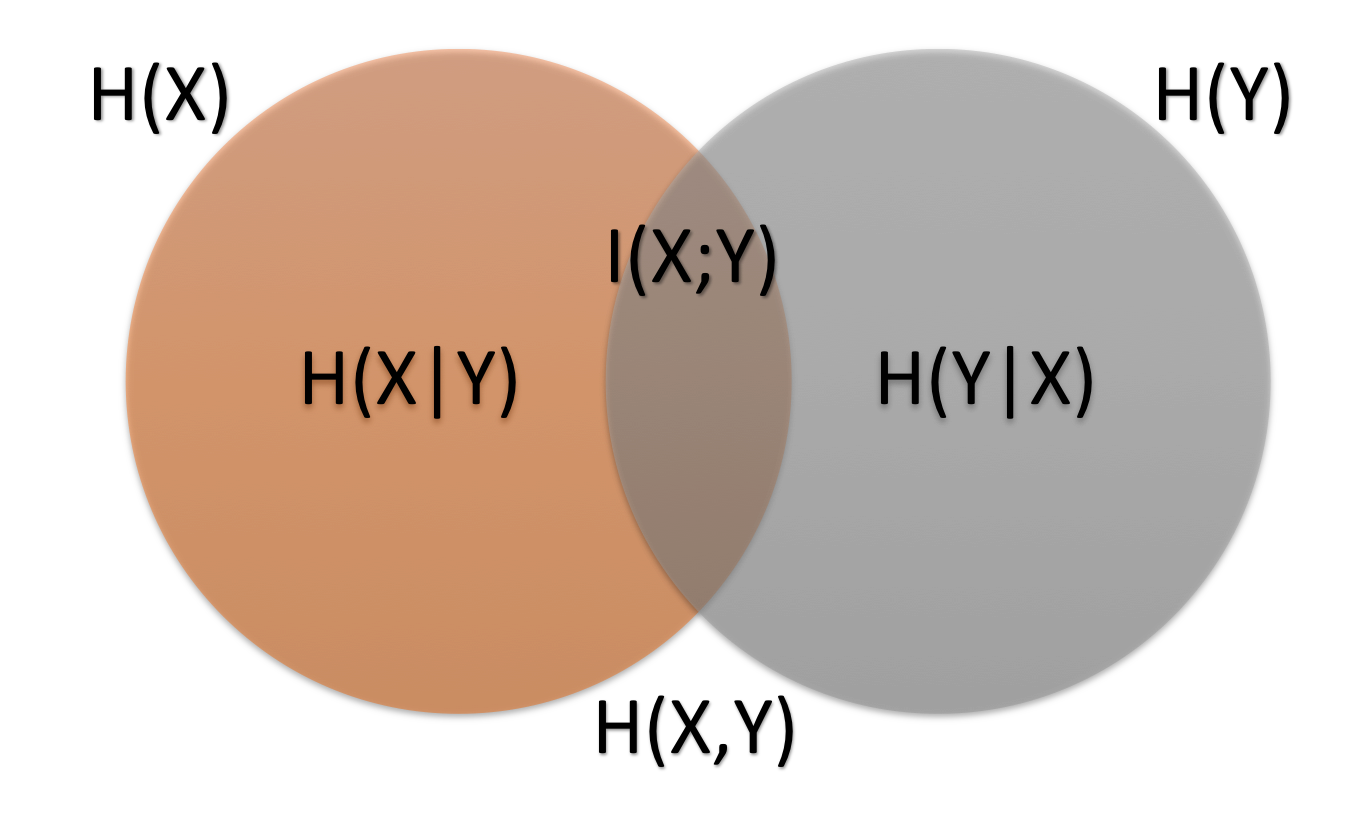
Information gain measures are discussed here. The Venn diagram defining the types of information is linked below.
Mutual Information
Mutual information between default and the test is calculated as follows. This is the entropy of the original base rate minus the conditional entropy of default given the test classification.
$$I(X;Y)=H(X)-H(X|Y)$$
$H(X)$, the entropy of the original base rate, is calculated as follows. The letters A through H, used in the formulae below, are as defined in the image here.
$$H(X)=(A)(log_2\ \frac{1}{A})\ +\ (B)(log_2\ \frac{1}{B})$$
$$H(X)=0.8113$$
$H(X|Y)$, the conditional entropy of default given the test classification, is calculated as
$$H(X|Y)=H(\frac{E}{C},\frac{G}{C})(C)+H(\frac{F}{D},\frac{H}{D})(D)$$
$$H(X|Y)=0.7253$$
Then, $I(X;Y)$ is calculated as
$$I(X;Y)=0.8113-0.7253=0.0860$$
Recall that the units for this value is mutual information, or “information gain,” in average bits per event.
Percent Information Gain (P.I.G.)
The Percent Information Gain (P.I.G.) is the ratio $\frac{I(X;Y)}{H(X)}$, calculated as follows.
$$\text{P.I.G.}=\frac{I(X;Y)}{H(X)}=\frac{0.0860}{0.8113}=10.6%$$
Savings Per Bit
Between the savings-per-event value and the bits-per-event value, just calculated, it is possible to measure a savings-per-bit value. This concept is powerful, because it places a financial value on the information content of a model or data source.
$$\text{savings-per-bit}=\frac{\text{savings-per-event}}{\text{bits-per-event}}$$
The savings-per-event value of $337 was calculated previously.
The bits-per-event value, or mutual information, value of 0.0860 was calculated above.
Thus the savings-per-bit is given by
$$\text{savings-per-bit}=\frac{$337}{0.0860}=$3919\text{ per bit}$$
Alternative Model Characteristics
A hypothetical competing model has the following performance characteristics. It outperforms my model.
$$\text{true positive count} = .180$$
$$\text{true positive rate} = .720$$
$$\text{positive predictive value} = .480$$
Mutual Information
$$I(X;Y)=H(X)-H(X|Y)$$
$$I(X;Y)=0.8113-0.6908=0.1205$$
Percent Information Gain (P.I.G.)
$$\text{P.I.G.}=\frac{I(X;Y)}{H(X)}=\frac{0.1205}{0.8113}=14.85%$$
Savings Per Bit
The cost per event for this alternative schema is $838. The savings per event is calculated as $$$1250-$838=$412$$.
$$\text{savings-per-bit}=\frac{$412}{0.1205}=$3419\text{ per bit}$$
Points of Comparison
The following table establishes the important points of comparison between the competing models.
| Parameters | My Model | Alternative Model |
|---|---|---|
| Mutual Information | 0.0860 | 0.1205 |
| Percent Information Gain | 10.6% | 14.9% |
| Cost per Event | $913 | $838 |
| Savings per Bit | $3919 | $3419 |
A few important differential comparisons are possible.
The incremental information gain of the alternative model over my model is
$$0.1205-0.0860=0.345\text{ bits per event}$$
If my model was available to an organization, the maximum price that the organization should be willing to pay for the alternative model is
$$$913-838=$75\text{ per event}$$
At this maximum break-even price per score, the incremental value per bit from the alternative model is
$$\frac{$75\text{ per event}}{0.1205\text{ bits per event}}=$622\text{ per bit}$$
AUC_Calculator-and-Review-of-AUC-Curve.xlsx
Data_Final-Project.xlsx
Information-Gain-Calculator.xlsx
Some other content is taken from my notes on other aspects of the aforementioned Coursera course.