Obtain Hex Codes for Matplotlib Color Cycle
Code below shows how to print out the color names and hex codes for the default Matplotlib Color Cycle.
import matplotlib.pyplot as plt
colors = plt.rcParams['axes.prop_cycle'].by_key()['color']
colors
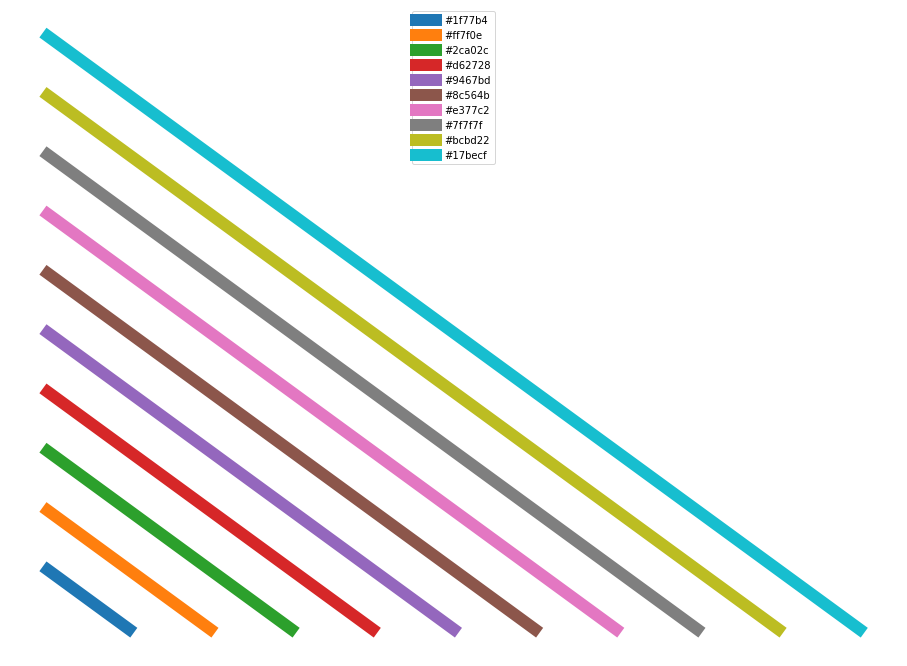
['#1f77b4',
 '#ff7f0e',
 '#2ca02c',
 '#d62728',
 '#9467bd',
 '#8c564b',
 '#e377c2',
 '#7f7f7f',
 '#bcbd22',
 '#17becf']
plt.figure(figsize=(16,12))

for inc in range(1,11,1):
    plt.plot([1+inc,1],
             [1,1+inc],
             linewidth=12);

plt.legend(colors,
           loc='upper center')

plt.tick_params(
    axis='x',
    bottom=False,
    labelbottom=False)
plt.tick_params(
    axis='y',
    left=False,
    labelleft=False)
for spine in plt.gca().spines.values():
    spine.set_visible(False)