Decision Trees
Decision Trees Representation
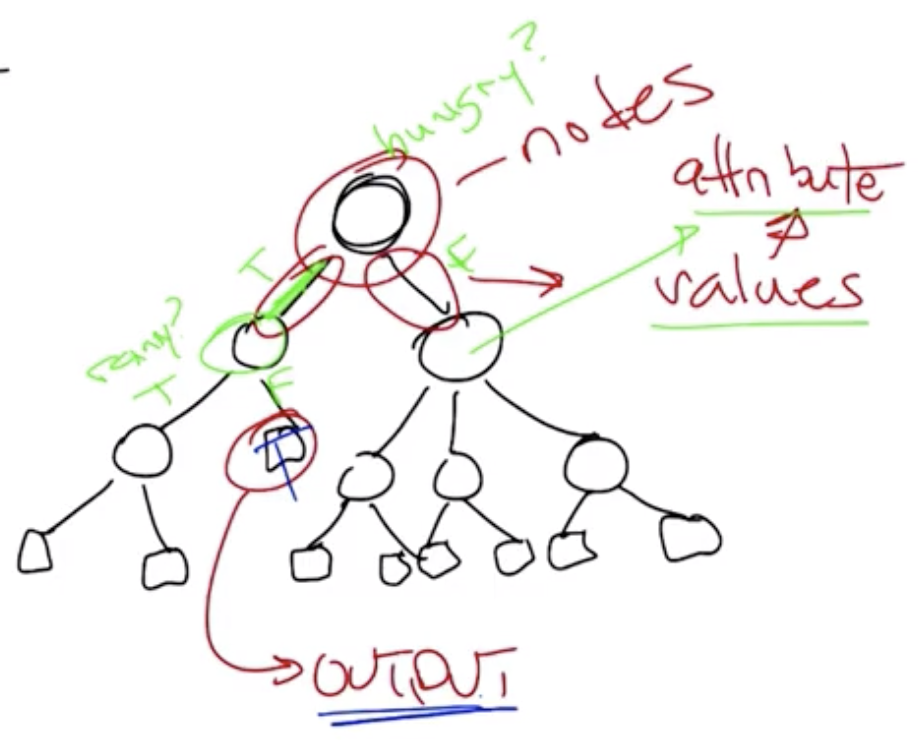
- Node: Circles in the tree representation, where decisions are made. Each node is an attribute, or item on which you will make a decision. For example: “Are you hungry?”
- Edges: Each is represented by one of multiple values the attribute can take. For example: “Yes” or “No”?
- Outputs: “Leaves,” or squares, in the tree representation, which represent answers to the question being asked in the decision tree.
- Root: Decision trees start at the root, or top, of the tree.
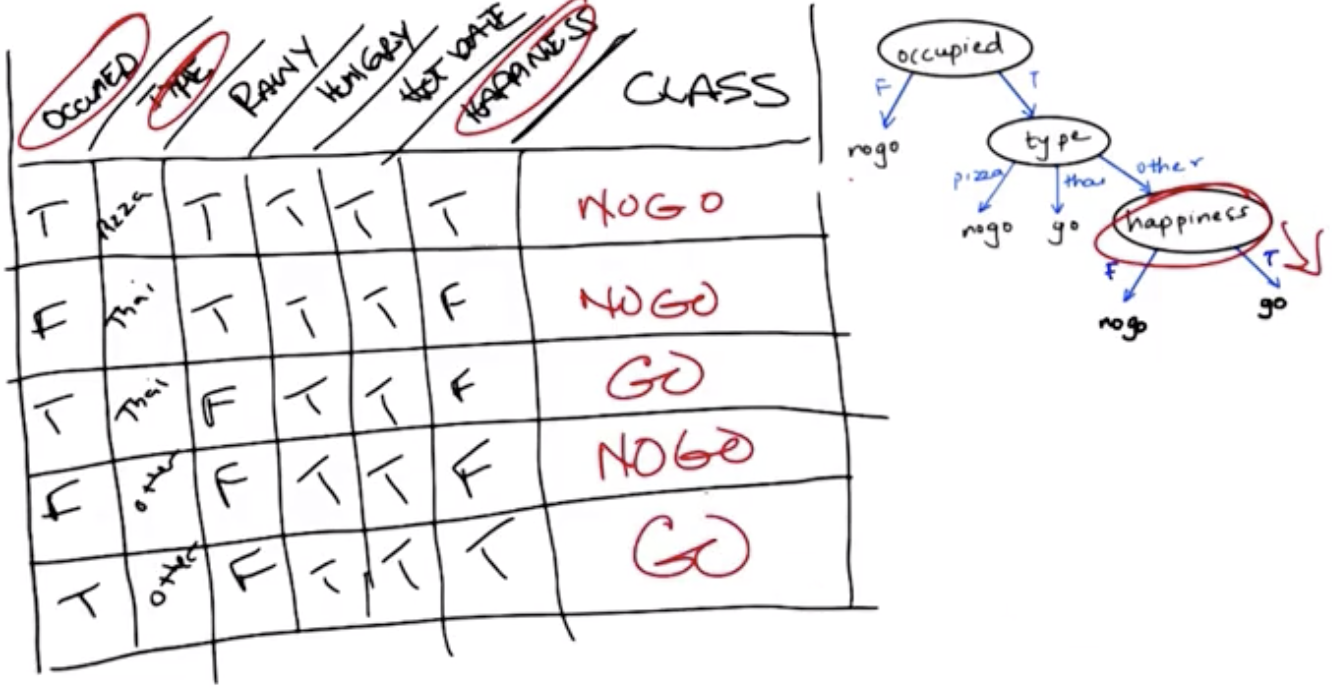
In the example shown above, the table represents the testing set, and the decision tree itself represents the candidate concept. Alternative trees using different nodes (such as rainy or hungry) would have been different candidate concepts.
Decision Tree Algorithm
- Pick the best attribute.
- “Best” attributes would split the possible input data as close as possible into 50-50, as shown below.
- Select that attribute.
- Follow each of the edges (or, possible answers).
- Go to 1 and repeat until an answer is found.
Decision Tree Examples
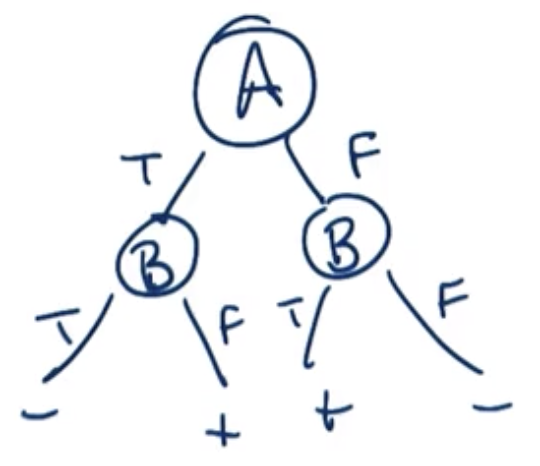
A AND B:
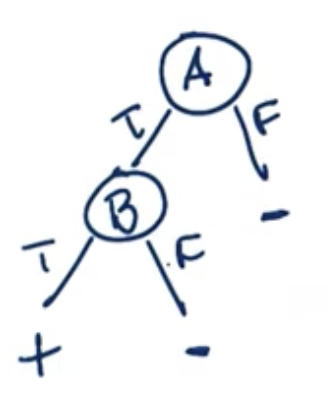
A OR B:
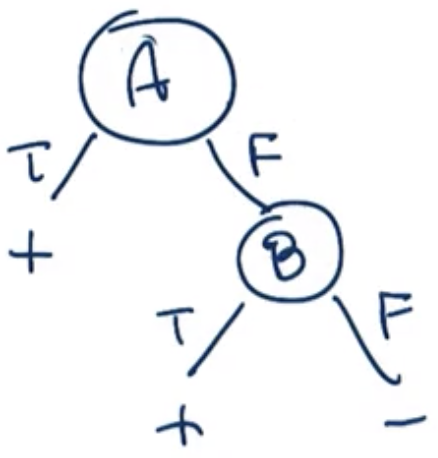
A XOR B:
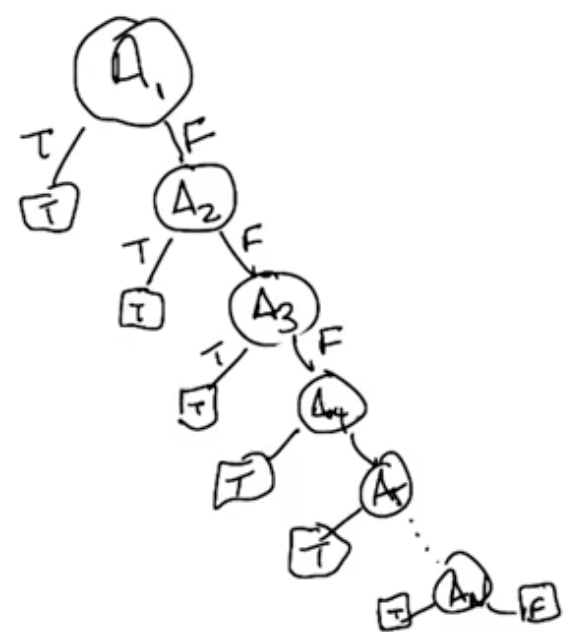
Generalized Or, “n-or” or “Any”
- For n rows, there are n nodes
- “Linear” in n
- Preferred structure for decision tree problems
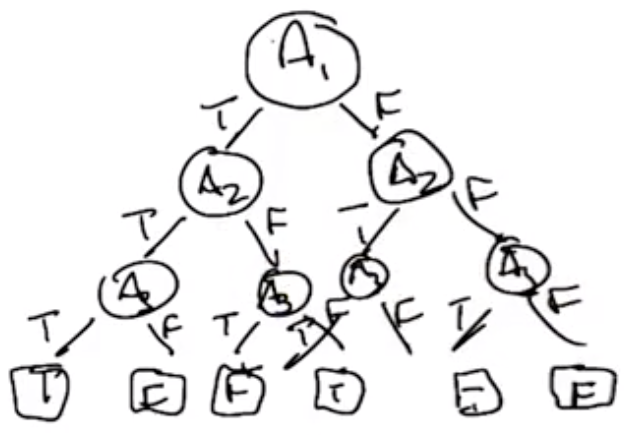
Generalized X-Or, “n-xor” or “Parity”
- “Odd Parity” used in this case
- For n rows, there are $2^n-1$ rows
- “Exponential” in n, or O($2^n$)
- Known as a “Hard” problem
- Not preferred structure for machine learning problems - there is no way to be clever and pick the correct attributes to simplify the structure.
How Expressive are Decision Trees?
- Assuming n boolean attributes, how many tress would be required to represent all possible configurations of the XOR structure?
- For the first node, there are n choices. Then, there are n-1, so there are $n!$ choices to build the nodes.
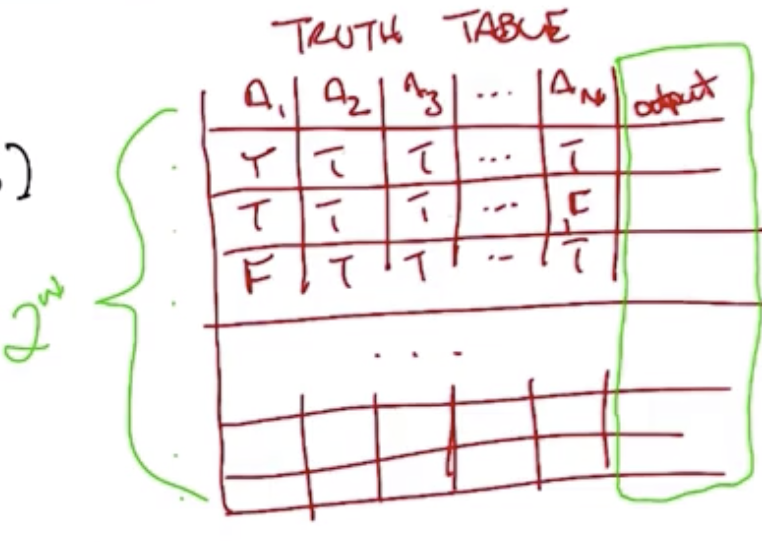
- The structure is analogous to a truth table similar to that shown below, and for which there are $2^n$ rows.
- For each row, there is a single output. So, there are $2^{2^n}$ ways to fill in the outputs. It is a “double exponential.”
- The first few numbers in the series are 4, 16, 256, but by n = 6, $2^{2^n}$ is a 19-digit number. IE, a double exponential grows very fast!
- The hypothesis space of decision tress is very expressive because it can represent many possible functions, but it also means that the algorithm that searches among the space must be carefully chosen in order to successfully navigate it in an efficient way.
ID3 - a Top Down Learning Algorithm
- Loop:
- A <- best attribute
- Assign A as decision attribute for Node
- For each value of A:
- Create a descendent of Node
- Sort training examples to leaves
- If training examples perfectly classified:
- Stop
- Otherwise: iterate over leaves
How do we quantify the “best attribute”?
-
Most common way: Choose attribute based on Maximum Information Gain
- Information Gain is a mathematical way to capture the amount of information gained by picking a particular attribute.
- Specifically, it is the reduction in randomness over the labels you have with a set of data by knowing the value of a particular attribute.
$$Gain(S,A)=Entropy(S)-\sum_{v} \frac{|S_v|}{|S|} Entropy(S_v)$$ That is the “information gained over S and A,” where:
-
$S$ is the collection of training examples being considered, and
-
$A$ is a particular attribute, and
-
$Entropy$ is a measure of randomness. The first term is the entropy with respect to the labels, S. The second term is the average or expected entropy you would have over each set of examples with a particular value.
Entropy
- Flipping a fair coin has a 50-50 probability and has 1 “bit” of entropy.
- Flipping a double-headed coin has a 100-0 probability and has 0 “bits” of entropy.
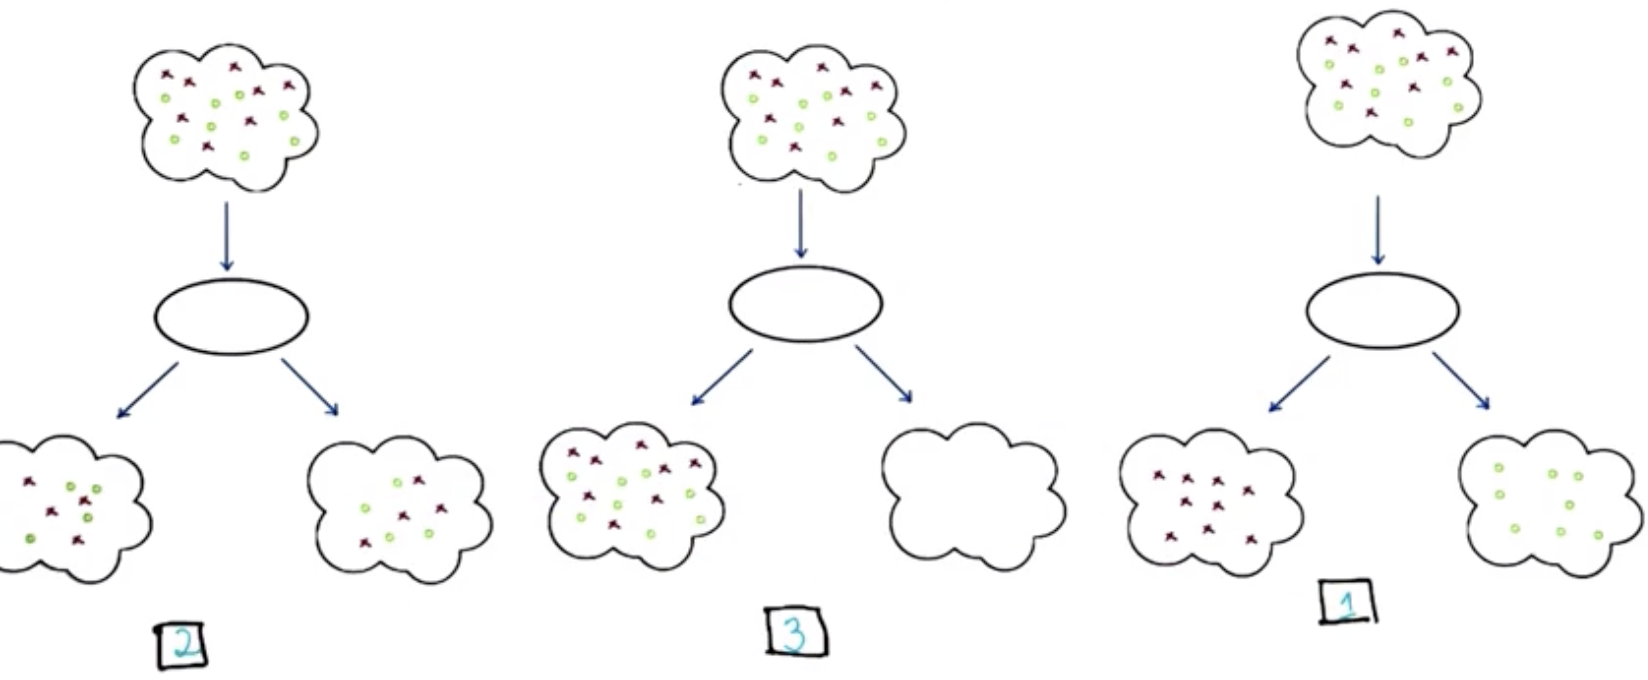
Recalling the diagram from before, if the red X’s and Green O’s are evenly split between the output categories then the entropy is maximum. On the other hand, if all the red X’s are together and separate from all the O’s, then the entropy is a minimum and we have more information going in.
Option 1: No Entropy, Maximum Information.
Option 2: High Entropy, No Information Gain.
Option 3: High Entropy, No Information Gain.
$$Entropy=\sum_{v} p(v) \log p(v)$$ where $p(v)$ is the probability of seeing that value.
Bias
Two types of inductive bias that we need to consider for algorithms searching through a solution space:
- Restriction Bias: $H$, restriction to the hypothesis set that is under consideration.
- In case of decision trees, this means that we restrict ourselves to trees, not y=2x+3, nor quadratic equations, non-boolean functions, etc.
- Impractical to actually consider the infinite set of functions, so we restrict to only solutions of a given type.
- Preference Bias: $n \in H$, which solutions in the hypothesis set does the algorithm prefer.
- This is at the real heart of inductive bias.
Decision Tree Bias
Decision Trees prefer:
- Good Splits at Top
- Correct Trees to Incorrect Trees
- Shorter Trees to Longer Trees
- A natural extension of preferring good splits at the top.
Other Considerations for Decision Trees
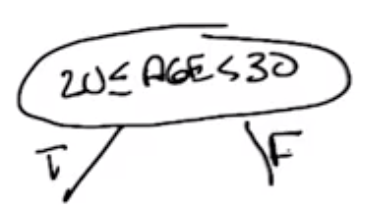
- Continuous Attributes:
- Examples: age, weight, distance, …
- One solution: use ranges
-
Does it make sense to repeat an attribute along a path in the tree?
- Discrete-valued attributes: No, splitting on an attribute that has already been split on would not result in information gain.
- Continuous-valued attributes: Yes, it does make sense because you may be asking a different question.
-
When do we stop the algorithm?
- When everything is classified correctly, but if there is noise (incorrectly-labeled values) in the data or repeated values that are classified differently, it is possible the algorithm may get stuck in an infinite loop.
- No more attributes
- No Overfitting
- Overfitting in decision trees means that the decision tree becomes excessively large
- Use pruning in combination with a cross-validation set to ensure the tree remains reasonably-sized.
- Use “voting” on the output.
-
Regression? For example, if the function is something like $x^2$
- Information gain doesn’t work because it isn’t clear how to measure information using continuous values.
- Splitting criteria? Use Variance rather than information gain.
- Use “voting” on the output.
For Fall 2019, CS 7461 is instructed by Dr. Charles Isbell. The course content was originally created by Dr. Charles Isbell and Dr. Michael Littman.