Logistic Regression
Logistic regression is a regression method that is actually used for classification. Like other regression methods, it takes a set of input variables (features) and estimates a target value. In its most basic form, logistic regression generates a binary output. There are other flavors of logistic regression that can be used in cases where the target value to be predicted is a multi class categorical variable.
Logistic regression is similar to linear regression except that the output is run through a logistic function.
$$\hat{y}_{linear}=\hat{b}+\hat{w_1} \cdot x_1+…+w_n \cdot x_n$$
$$\hat{y}_{logistic}=logistic(\hat{b}+\hat{w_1} \cdot x_1+…+w_n \cdot x_n)$$
The logistic function transforms real-valued input to an output number, $y$ between 0 and 1, which is interpreted as the probability the input object belongs to the positive class, given its input features $(x_0, x_1,…,x_n)$.
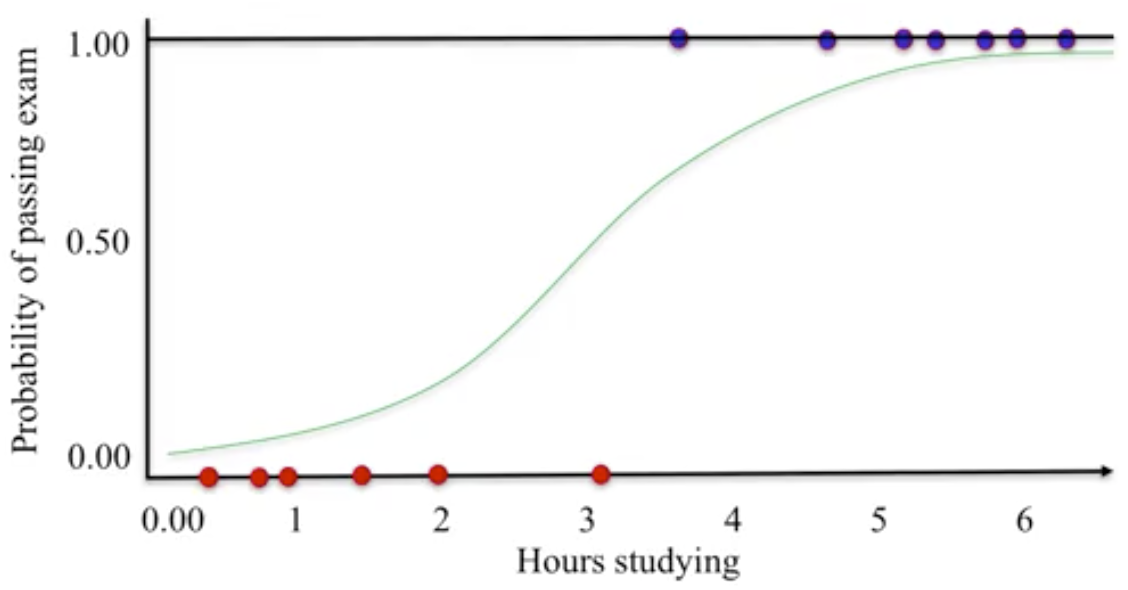 Any data whose logistic probability estimate, $hat{y}$, is greater than or equal to 0.5 are predicted to be in the positive blue class. Otherwise, the negative red class.
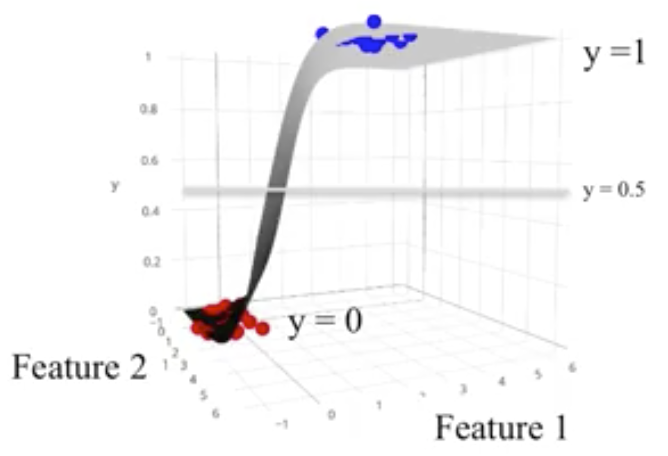
This same concept is also generalizable to higher dimensional spaces.
 The following plot shows logistic regression applied to a subset of the fruits dataset, specifically, the height, width, and label of the fruit. The fruit labels are simplified to be binary: the fruit is either an apple or not an apple.
Like ridge and lasso regression, a regularization penalty on the model coefficients can also be applied with logistic regression. It is controlled with the parameter C. By defualt, the same L2 regularization penalty used for ridge regression is turned on by default for logistic regression with default C set to 1. Higher values of C correspond to less regularization, and the model tries to fit the training data as well as possible. With small values of C, the model tries to find model coefficients that are closer to 0, even if the model fits the training data worse.
plot_fruit_dataset_binary_classifier(C=100)
<IPython.core.display.Javascript object>

plot_fruit_dataset_binary_classifier(C=1)
<IPython.core.display.Javascript object>

plot_fruit_dataset_binary_classifier(C=0.1)
<IPython.core.display.Javascript object>

On the breast cancer dataset, the logistic regression algorithm scores nearly 96% on both the training and test datasets.
from sklearn.datasets import load_breast_cancer

(X_cancer, y_cancer) = load_breast_cancer(return_X_y = True)

X_train, X_test, y_train, y_test = train_test_split(X_cancer,
                                                    y_cancer,
                                                    random_state = 0)

clf = LogisticRegression(max_iter=5000).fit(X_train,
                                            y_train)
print('Breast cancer dataset')
print('Accuracy of Logistic regression classifier on training set: {:.2f}'
     .format(clf.score(X_train,
                       y_train)))
print('Accuracy of Logistic regression classifier on test set: {:.2f}'
     .format(clf.score(X_test,
                       y_test)))
Breast cancer dataset
Accuracy of Logistic regression classifier on training set: 0.96
Accuracy of Logistic regression classifier on test set: 0.95
Utility Functions and Datasets Used Above
%matplotlib notebook

import pandas as pd
import numpy as np
import matplotlib.pyplot as plt
from matplotlib.colors import ListedColormap

from sklearn.model_selection import train_test_split
from sklearn.linear_model import LogisticRegression


fruit_datafile = 'logistic-regression/fruit_data_with_colors.txt'
fruit = (pd.read_csv(fruit_datafile,
                     sep='\t')
         [['mass','width','height','color_score',
           'fruit_label',
           'fruit_name','fruit_subtype']])
X_fruits_2d = fruit[['height', 'width']]
y_fruits_2d = fruit['fruit_label']
def plot_fruit_dataset_binary_classifier(C=100):
    fig, subaxes = plt.subplots(1, 1, figsize=(7, 5))
    y_fruits_apple = y_fruits_2d == 1
    X_train, X_test, y_train, y_test = (
    train_test_split(X_fruits_2d.values,
                     y_fruits_apple.values,
                     random_state = 0))

    title = 'Logistic regression for binary classification\n\
    Fruit dataset: Apple vs others, C={}'.format(C)

    clf = LogisticRegression(C=C).fit(X_train, y_train)
    plot_class_regions_for_classifier_subplot(clf,
                                              X_train,
                                              y_train,
                                              None,
                                              None,
                                              title,
                                             subaxes)
def plot_class_regions_for_classifier_subplot(clf,
                                              X,
                                              y,
                                              X_test,
                                              y_test,
                                              title,
                                              subplot,
                                              target_names = None,
                                              plot_decision_regions = True):

    numClasses = np.amax(y) + 1
    color_list_light = ['#FFFFAA', '#EFEFEF', '#AAFFAA', '#AAAAFF']
    color_list_bold = ['#EEEE00', '#000000', '#00CC00', '#0000CC']
    cmap_light = ListedColormap(color_list_light[0:numClasses])
    cmap_bold  = ListedColormap(color_list_bold[0:numClasses])

    h = 0.03
    k = 0.5
    x_plot_adjust = 0.1
    y_plot_adjust = 0.1
    plot_symbol_size = 50

    x_min = X[:, 0].min()
    x_max = X[:, 0].max()
    y_min = X[:, 1].min()
    y_max = X[:, 1].max()
    x2, y2 = np.meshgrid(np.arange(x_min-k,
                                   x_max+k,
                                   h),
                         np.arange(y_min-k,
                                      y_max+k,
                                      h))

    P = clf.predict(np.c_[x2.ravel(), y2.ravel()])
    P = P.reshape(x2.shape)

    if plot_decision_regions:
        subplot.contourf(x2, y2, P, cmap=cmap_light, alpha = 0.8)

    subplot.scatter(X[:, 0],
                    X[:, 1],
                    c=y,
                    cmap=cmap_bold,
                    s=plot_symbol_size,
                    edgecolor = 'black')
    subplot.set_xlim(x_min - x_plot_adjust, x_max + x_plot_adjust)
    subplot.set_ylim(y_min - y_plot_adjust, y_max + y_plot_adjust)

    if (X_test is not None):
        subplot.scatter(X_test[:, 0],
                        X_test[:, 1],
                        c=y_test,
                        cmap=cmap_bold,
                        s=plot_symbol_size,
                        marker='^',
                        edgecolor = 'black')
        train_score = clf.score(X, y)
        test_score  = clf.score(X_test, y_test)
        title_append = "\nTrain score = {:.2f},\
                        Test score = {:.2f}".format(train_score,
                                                    test_score)
        title = title + title_append

    subplot.set_title(title)

    if (target_names is not None):
        legend_handles = []
        for i in range(0, len(target_names)):
            patch = mpatches.Patch(color=color_list_bold[i],
                                   label=target_names[i])
            legend_handles.append(patch)
        subplot.legend(loc=0, handles=legend_handles)