Plotting Mathematical Functions using Matplotlib
Canonical Import Statements
import numpy as np
import matplotlib.pyplot as plt
Define the Function
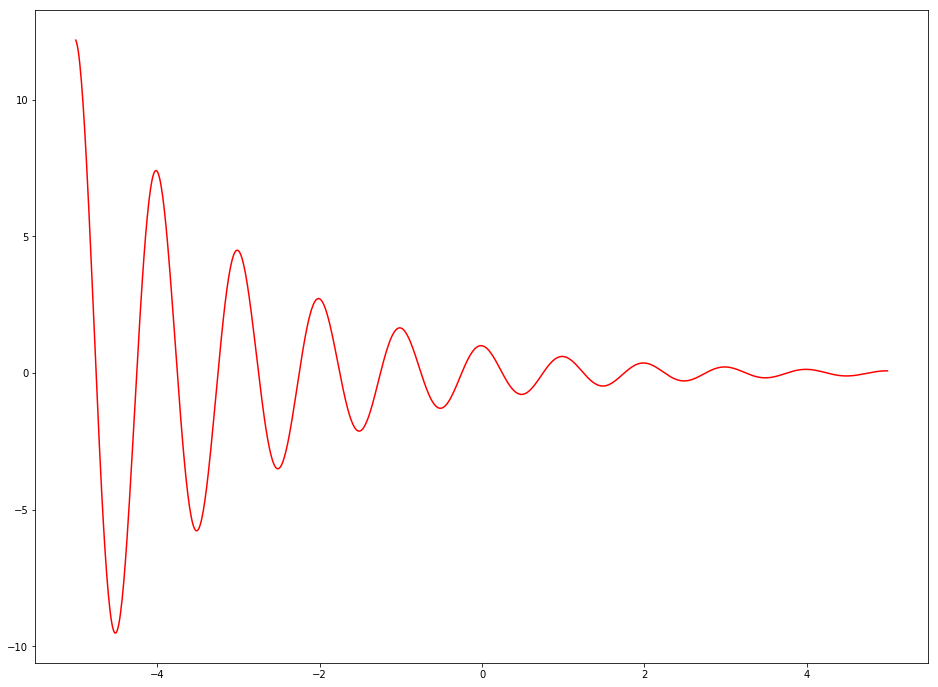
def f(t):
    return np.exp(- (1/2) * t) * np.cos(2*np.pi*t)
$$f(t) = e^{- \frac{1}{2} t} cos(2 \pi t)$$
Define the range for the data
r = np.arange(-5, 5.0, 0.01)
print(len(r))
print(r[:10])
print(r[-10:])
1000
[-5.   -4.99 -4.98 -4.97 -4.96 -4.95 -4.94 -4.93 -4.92 -4.91]
[4.9  4.91 4.92 4.93 4.94 4.95 4.96 4.97 4.98 4.99]
Create and Show the Plots
plt.figure(figsize=(16,12))
plt.plot(r, f(r), 'r-')
plt.show()