Find and Fix Bugs with Apex Replay Debugger
These are technical notes I compiled while studying using Trailhead, Salesforce's free self-learning portal.
Set breakpoints and checkpoints to step through code and inspect variable values at specific line numbers in a debug session.
Invoke Apex tests and download debug logs using Visual Studio Code.
Find and fix a bug using Apex Replay Debugger for Visual Studio Code.
Launch Your Trailhead Playground
- Introduction
- “Any bug not detected in the design phase will cost ten times more time to detect at the coding phase and an additional ten times more at the debugging phase.” — Dr. Nikolai Bezroukov, The Art of Debugging
- IE, catching bugs sooner in the process is better
- Debugging is distinct from Testing in software development
- Testing: attempts to find and report errors
- Debugging: attempts to identify the cause of those errors and fix them
- Apex provides testing support with a framework for isolated execution of Apex tests:
- Includes nonproduction orgs such as sandboxes/scratch orgs:
- Debugging support through
System.debugstatement, debug logs, and debuggers
- When trace flags are enabled, Apex code generates debug logs, which are recordings of all interactions in a transaction
- Apex Replay Debugger simulates a live debugging session using a debug log
- Presents the logged information, including variable values, call stack, and breakpoints, similar to an interactive debugger
- “Any bug not detected in the design phase will cost ten times more time to detect at the coding phase and an additional ten times more at the debugging phase.” — Dr. Nikolai Bezroukov, The Art of Debugging
- What is Apex Replay Debugger?
- Free tool that allows you to debug your Apex code by inspecting debug logs using VS Code as the client
- Gives you the same features you expect from other debuggers:
- View variables, set breakpoints, hover over variables to see their current value
- Idea is that you no longer need to parse through long log files manually or use
System.debugstatements to see variable values/track execution path
- Gives you the same features you expect from other debuggers:
- Makes it easy to work asynchronously and collaboratively solve problems
- Launch a replay debugger session from any replay-enabled debug log, so clients and coworkers can share debug logs to help each other solve problems
- Start a debugging session by opening a debug log in VS Code and right-clicking any line in the file to launch debugger
- Free tool that allows you to debug your Apex code by inspecting debug logs using VS Code as the client
- What is Apex Interactive Debugger?
- Apex Interactive Debugger allows customers to debug their Apex code on sandboxes and scratch orgs in real time using VS Code
- Comes with features for independent software vendor partners (ISVs) working with subscribers who install a managed package
- Apex Interactive Debugger and ISV Customer Debugger are paid products
- Rest of this page focuses on setting up and using the free Apex Replay Debugger
Set Up Visual Studio Code
- Set Up Visual Studio Code
- Apex Replay Debugger is part of the Salesforce Extension Pack for VS Code
- Extensions require VS Code, Salesforce CLI, and Java 11 or 8
- Apex Replay Debugger is part of the Salesforce Extension Pack for VS Code
- Install and Update Salesforce CLI
- Install Salesforce CLI from https://developer.salesforce.com/tools/sfdxcli
- Confirm Salesforce CLI is installed properly by running the following from a command prompt or terminal:
sfdx update
- Install and Update Visual Studio Code
- Install Visual Studio Code from https://code.visualstudio.com/Download
- Install and Update Salesforce Extensions for Visual Studio Code
- In VS Code, click the View menu and then choose Extensions
- Then enter
salesforce extension packin search box - Then click Install or Update from the Salesforce Extension Pack result
- Once installed, relaunch Visual Studio Code to ensure the changes take effect
- Install Java Platform Standard Edition Development Kit
- Apex support in Salesforce Extensions for Visual Studio Code depend on the Java Platform, Standard Edition Development Kit (JDK)
- Requires an installation of either JDK version 17 (recommended), JDK version 11, or JDK version 8
- Install Java according to recommendations in Salesforce Extensions documentation
- Confirm Java is installed by finding its installation directory.
- Ex, for JDK8 update 201:
- Windows:
C:\Program Files\Java\jdk1.8.0_201 - MacOS:
/Library/Java/JavaVirtualMachines/jdk1.8.0_201.jdk/Contents/Home
- Windows:
- To determine this location from the command line, on Mac, run:
/usr/libexec/java_hometo get the default JDK location/usr/libexec/java_home -Vto find all installed JDKs
- Ex, for JDK8 update 201:
- Configure Java Home Setting for Apex Support
- In VS Code, go to Code > Preferences > Settings on macOS, File > Preferences > Settings on Windows, enter
apex javain the search, then in thesalesforcedx-vscode-apex.java.homeenter the Java installation directory you want to use, relaunch VS Code, open a terrminal window, and runjava -versionto ensure the setting worked
- In VS Code, go to Code > Preferences > Settings on macOS, File > Preferences > Settings on Windows, enter
Set Up Apex Replay Debugger
- Create a Salesforce DX Project
- Use
Cmd+Ship+Pin VS Code, then thesfdx create projectcommand - See Trailhead for more details
- Use
- Create an Apex Class
- In VS Code, right-click
classes, then choose SFDX: Create Apex Class, create the class below - See Trailhead for more details
- In VS Code, right-click
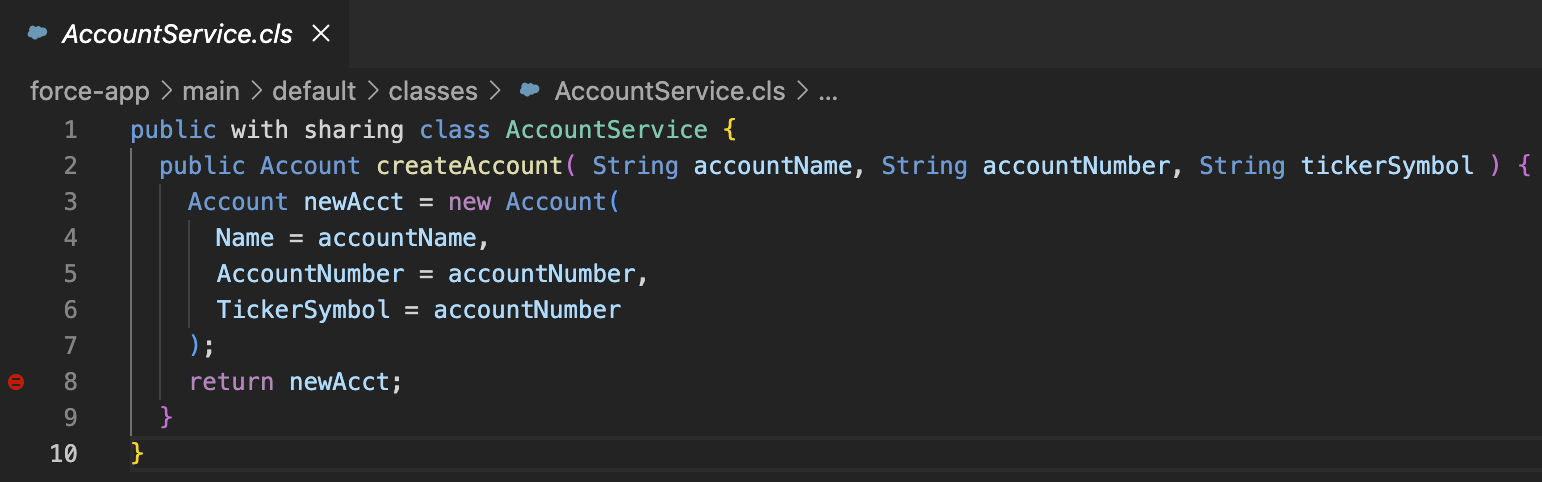
public with sharing class AccountService {
  public Account createAccount( String accountName, String accountNumber, String tickerSymbol ) {
    Account newAcct = new Account(
      Name = accountName,
      AccountNumber = accountNumber,
      TickerSymbol = accountNumber
    );
    return newAcct;
  }
}
- Create an Apex Test
- In VS Code, right-click
classes, then choose SFDX: Create Apex Class, create the class below - See Trailhead for more details
- In VS Code, right-click
@IsTest
private class AccountServiceTest {
  @IsTest
  static void should_create_account() {
    String acctName = 'Salesforce';
    String acctNumber = 'SFDC';
    String tickerSymbol = 'CRM';
    Test.startTest();
      AccountService service = new AccountService();
      Account newAcct = service.createAccount( acctName, acctNumber, tickerSymbol );
      insert newAcct;
    Test.stopTest();
    List<Account> accts = [ SELECT Id, Name, AccountNumber, TickerSymbol FROM Account WHERE Id = :newAcct.Id ];
    System.assertEquals( 1, accts.size(), 'should have found new account' );
    System.assertEquals( acctName, accts[0].Name, 'incorrect name' );
    System.assertEquals( acctNumber, accts[0].AccountNumber, 'incorrect account number' );
    System.assertEquals( tickerSymbol, accts[0].TickerSymbol, 'incorrect ticker symbol' );
  }
}
- Authorize an Org
- Use
Cmd-Shift-Pthensfdx authorize org, selecting the default org option for Trailhead orgs - See Trailhead for more details
- Use
Debug Your Code
- Deploy Metadata to Org
- In VS Code, right-click the folder
classesthen choose SFDX: Deploy Source to Org - If the command fails, try restarting VS Code
- In VS Code, right-click the folder
- Run Apex Tests
- Cmd+Shift+P, then enter
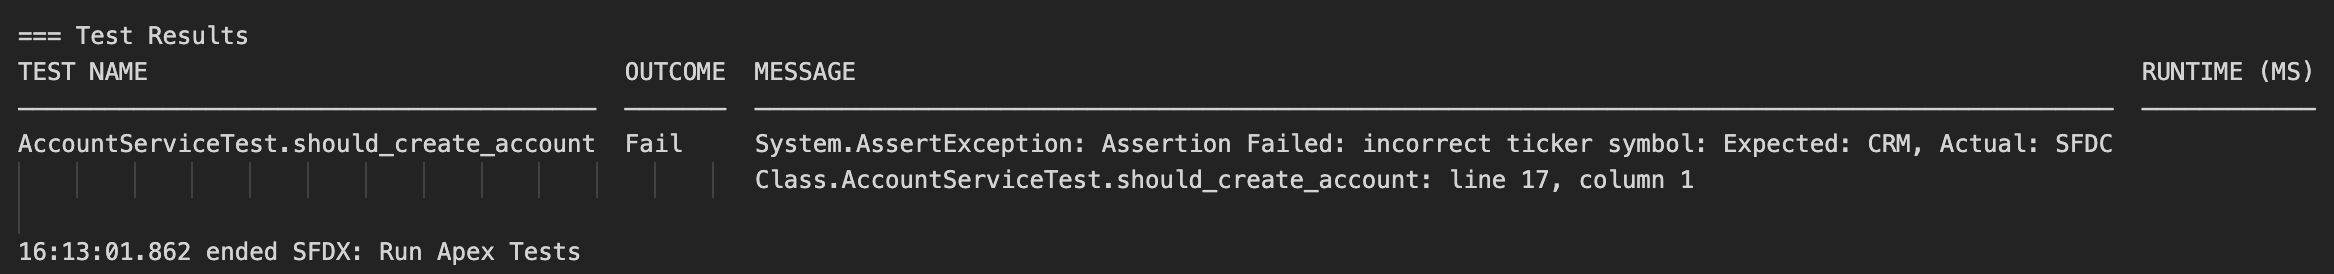
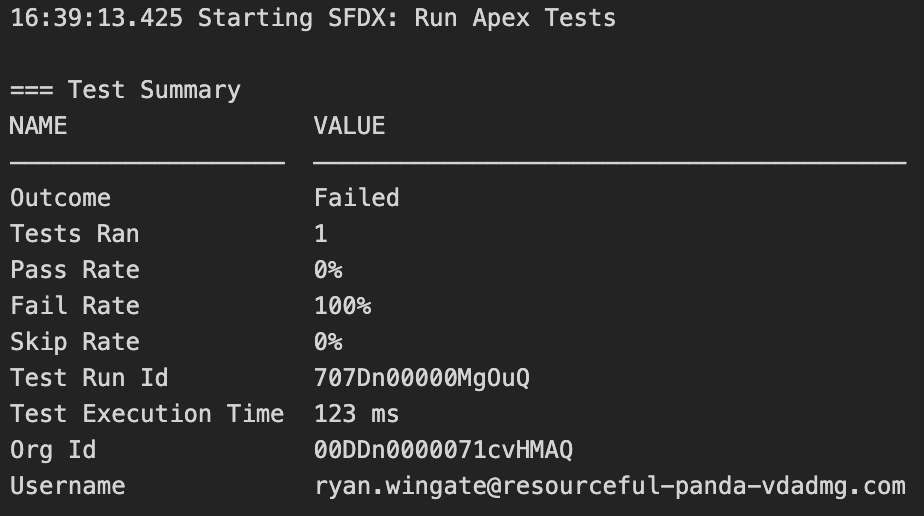
apex testin the search box, then chooseSFDX: Run Apex Tests, then select the test you want to run - Note that running
AccountServiceTestwith the code from above will result in a failure:- Error message indicates the wrong value was assigned to the account’s ticker symbol field
- Next steps, below, involve setting a checkpoint in the code, rerunning the test to collect a log, and replaying the debug log to find our code bug
- Cmd+Shift+P, then enter
- Set Breakpoints and Checkpoints
- When debugging, Breakpoints instruct the running program to pause at a specific line number so the developer can inspect variable values at that point in time
- Set as many breakpoints as you want
- Display as a solid red dot
- Checkpoints are a type of Breakpoint that provides more information by capturing heap dumps
- Can set up to 5 checkpoints at a time
- Display as a red circle with a line through the center
- Use
Debug: Toggle BreakpointandSFDX: Toggle Checkpointcommands to toggle on and off breakpoints and checkpoints
- Place your cursor on the line where you want to add a checkpoint
Cmd+Shift+P, search forsfdx checkpoint, then selectSFDX: Toggle Checkpoint. A checkpoint will show up on that line of code.Cmd+Shift+P, search forsfdx checkpoint, then selectSFDX: Update Checkpoints in Org. This step tells Salesforce about the checkpoints so that heap dumps are collected as Apex code executes.- Note that checkpoints expire after 30 minutes and heap dumps expire after a day
- When debugging, Breakpoints instruct the running program to pause at a specific line number so the developer can inspect variable values at that point in time
- Run Apex Test and Get Debug Logs
Cmd+Shift+P, then search forsfdx replay, then selectSFDX: Turn On Apex Debug Log for Replay DebuggerCmd+Shift+P, then search forapex text, then chooseSFDX: Run Apex Tests, then choose the tests you want- Now, running the test will generate a replay-enabled debug log and checkpoints to help find the bug
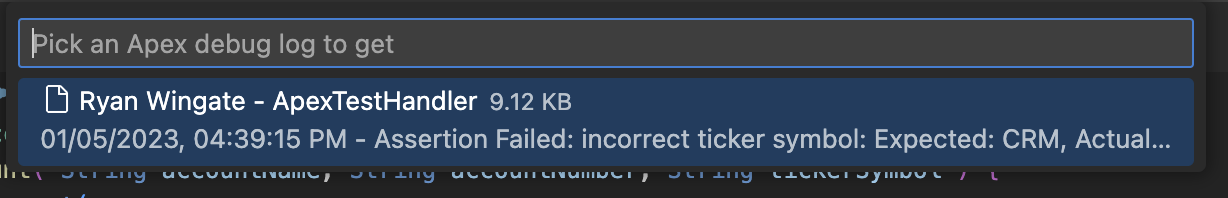
Cmd+Shift+P, then search forsfdx get, then chooseSFDX: Get Apex Debug Logs
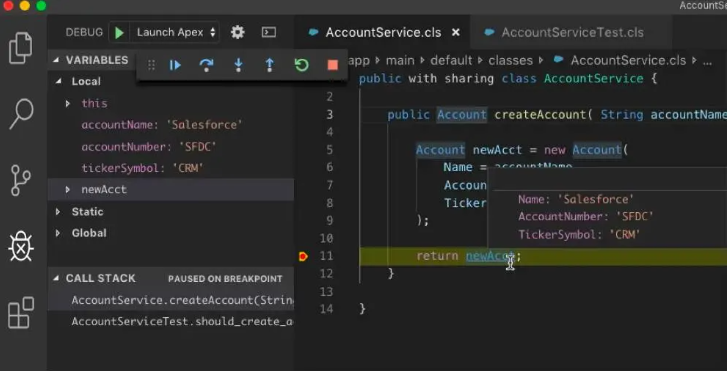
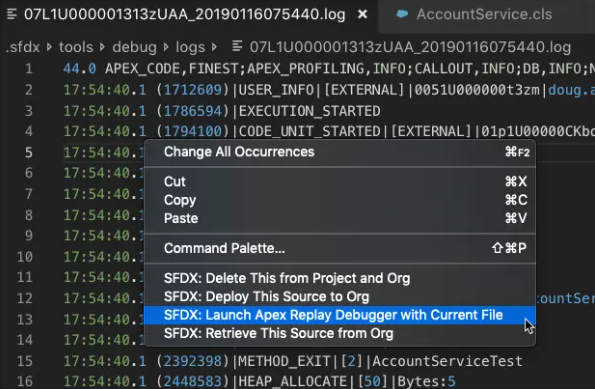
- Replay an Apex Debug Log
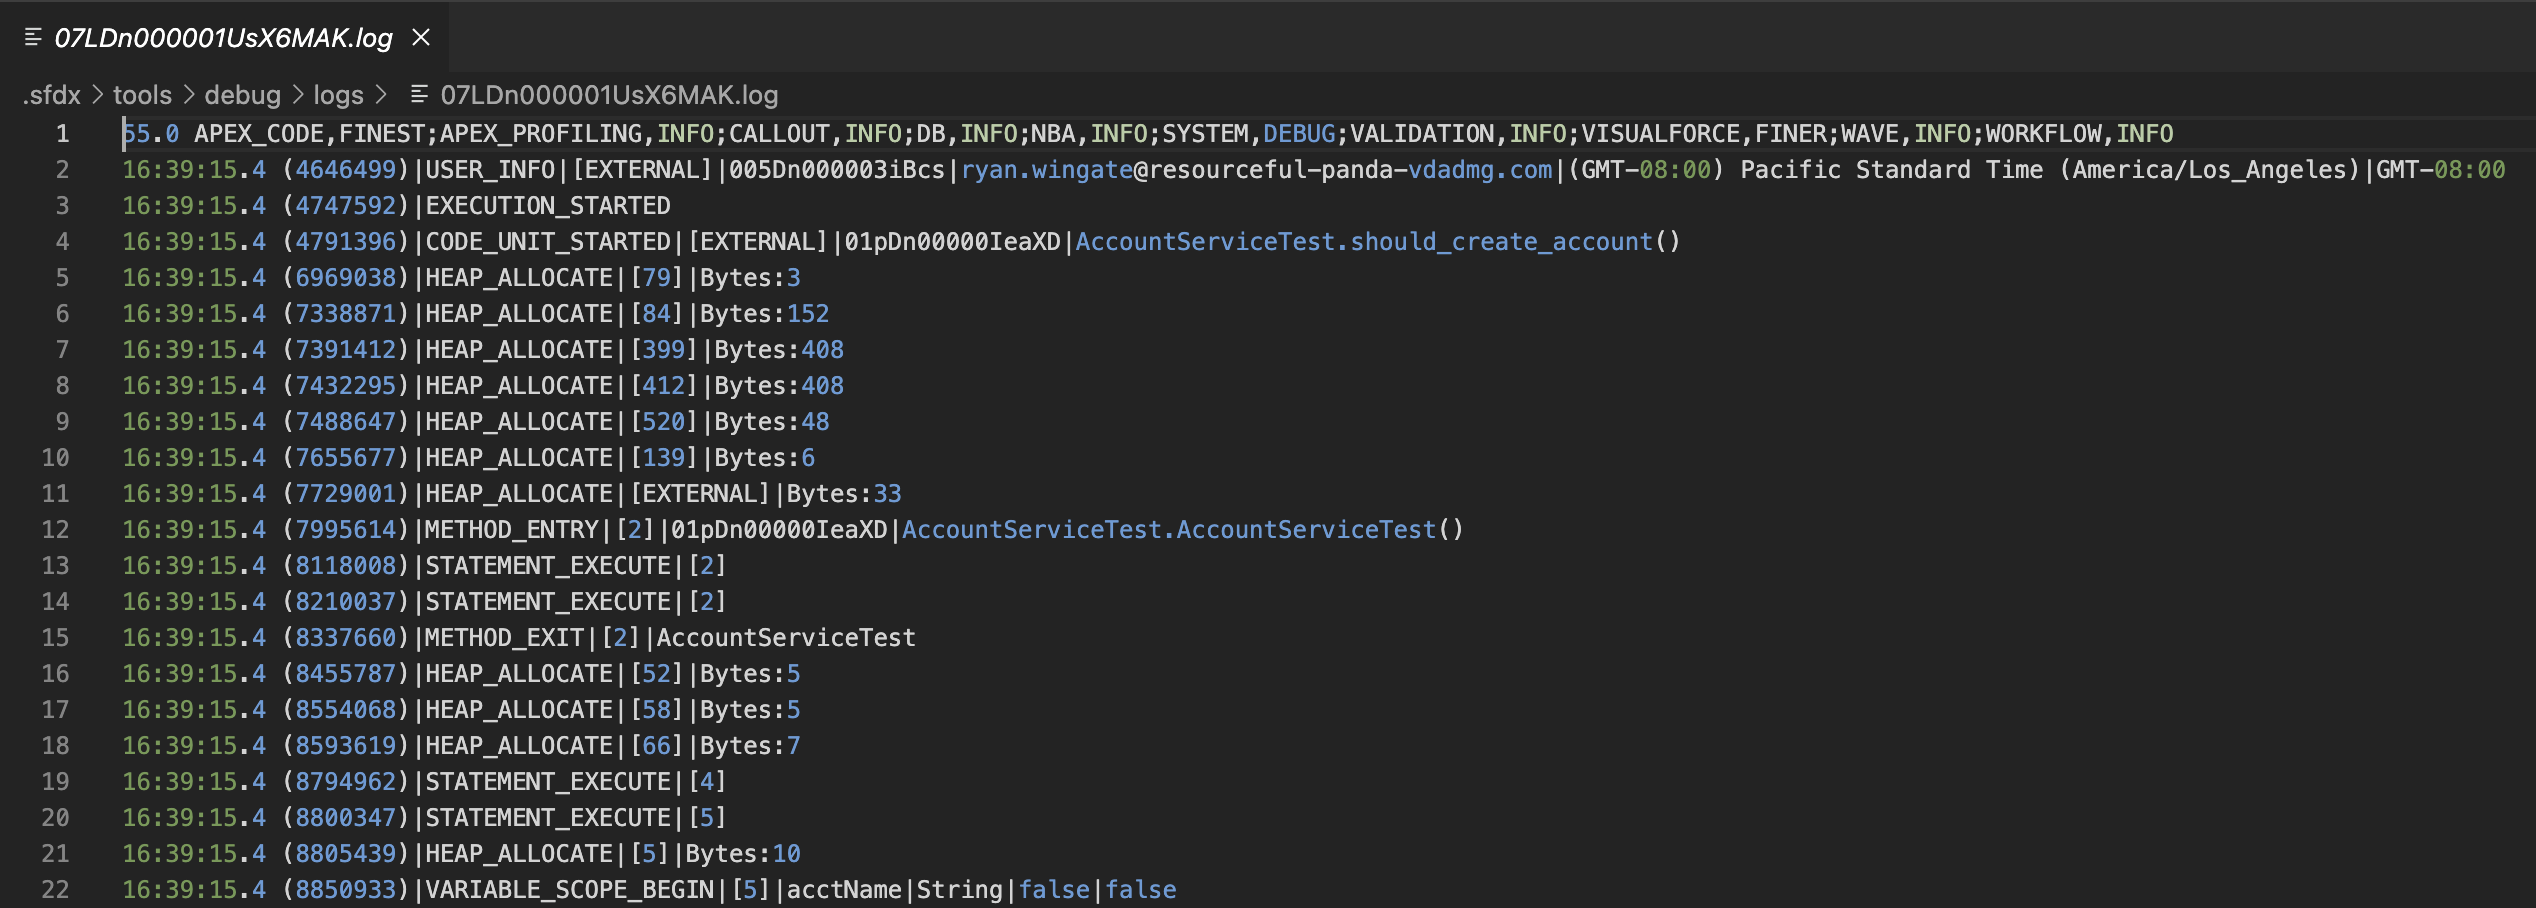
- Open the debug log
- Right-click any line in the debug log then choose
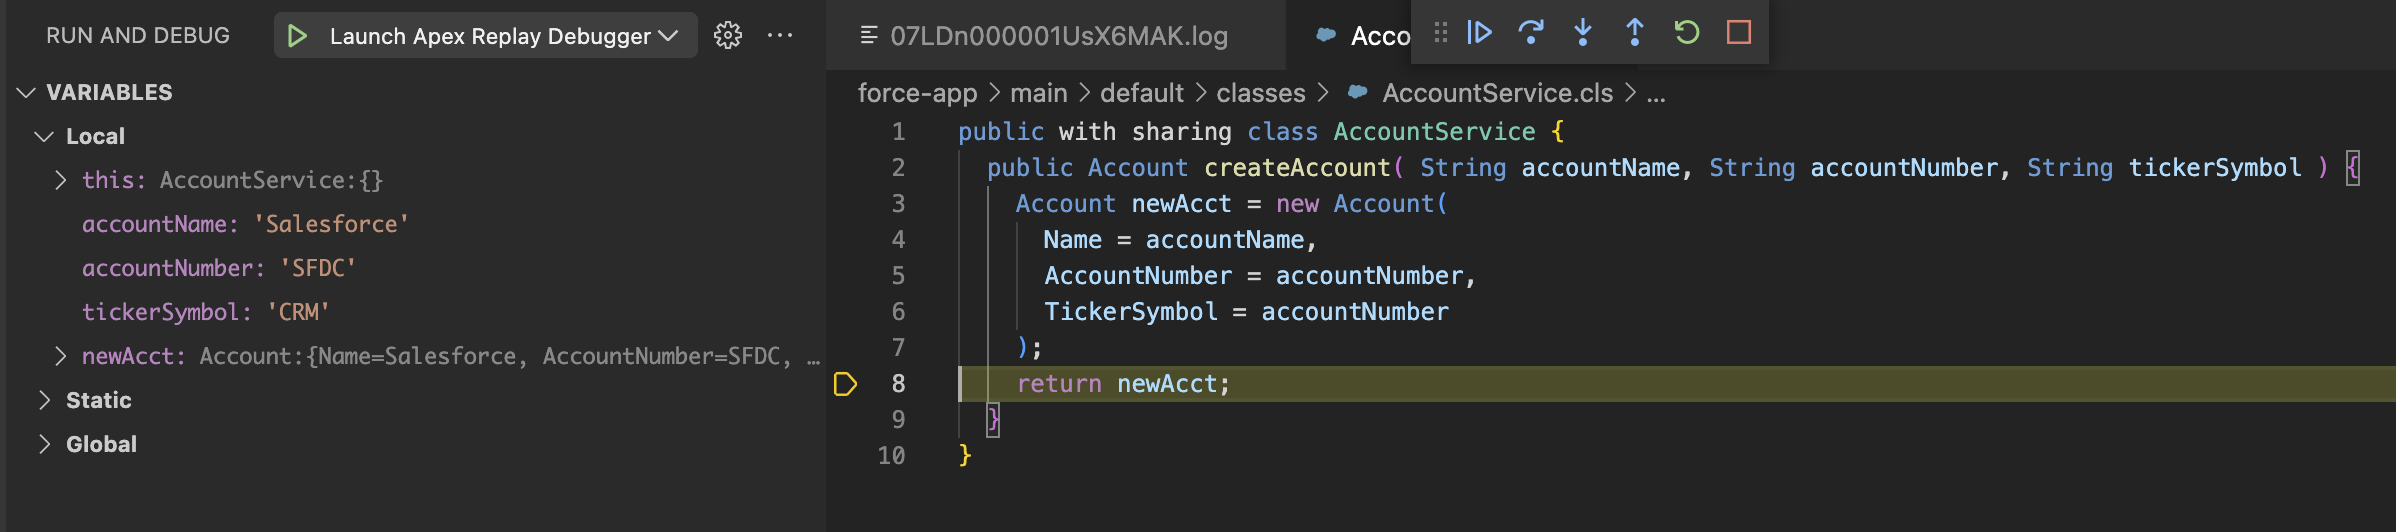
SFDX: Launch Apex Replay Debugger with Current File - Select the “Play Icon” in the Debug Toolbar to continue to the first breakpoint
- At that point, the Apex Replay Debugger pauses on the line. The Debug sidebar displays the current variable values in scope. Use this information to debug the class.
- Deploy Fixed Metadata to Org
- The line that needs to be fixed in
AccountService.cls, above, is the following. - Update it, then right-click and choose
SFDX: Deploy This Source to Org
- The line that needs to be fixed in
TickerSymbol = tickerSymbol
- Run Apex Tests to Verify Fix
- To re-run tests,
Cmd+Shift+P, then search forapex test, then chooseSFDX: Run Apex Tests - Following the fix above, the Apex tests pass
- To re-run tests,