Feature Scaling with KMeans
import numpy as np
import pandas as pd
from sklearn.cluster import KMeans
import matplotlib.pyplot as plt
from sklearn import preprocessing as p
from sklearn.datasets import make_blobs

%matplotlib inline

plt.rcParams['figure.figsize'] = (4, 3)

data, y = make_blobs(n_samples=200,
                     n_features=2,
                     centers=4,
                     random_state=42)

df = pd.DataFrame(data)
df.columns = ['height', 'weight']
df['height'] = np.abs(df['height']*100)
df['weight'] = df['weight'] + np.random.normal(50, 10, 200)
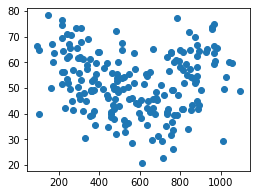
Next, take a look at the data to get familiar with it. The dataset has two columns, and it is stored in the df variable. It might be useful to get an idea of the spread in the current data, as well as a visual of the points.
df.describe()
| height | weight | |
|---|---|---|
| count | 200.000000 | 200.000000 |
| mean | 569.726207 | 52.100192 |
| std | 246.966215 | 11.937835 |
| min | 92.998481 | 20.656424 |
| 25% | 357.542793 | 42.704606 |
| 50% | 545.766752 | 52.038721 |
| 75% | 773.310607 | 61.404287 |
| max | 1096.222348 | 78.362636 |
df.head()
| height | weight | |
|---|---|---|
| 0 | 650.565335 | 56.061702 |
| 1 | 512.894273 | 67.478788 |
| 2 | 885.057453 | 58.352092 |
| 3 | 1028.641210 | 54.324747 |
| 4 | 746.899195 | 56.624122 |
plt.scatter(df['height'], df['weight']);
There are two common types of feature scaling:
- StandardScalar: scales the data so it has mean 0 and variance 1.
- MinMaxScalar: useful in cases where it makes sense to think of the data in terms of the percent they are as compared to the maximum value.
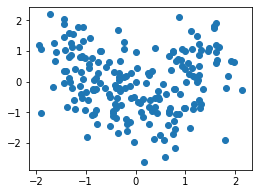
StandardScalar
df_ss = p.StandardScaler().fit_transform(df)
df_ss = pd.DataFrame(df_ss)
df_ss.columns = ['height', 'weight']

plt.scatter(df_ss['height'], df_ss['weight']);
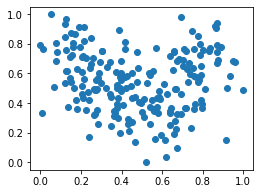
MinMaxScalar
df_mm = p.MinMaxScaler().fit_transform(df)
df_mm = pd.DataFrame(df_mm)
df_mm.columns = ['height', 'weight']

plt.scatter(df_mm['height'], df_mm['weight']);
Fit KMeans
def fit_kmeans(data, centers):
    kmeans = KMeans(centers)
    labels = kmeans.fit_predict(data)
    return labels
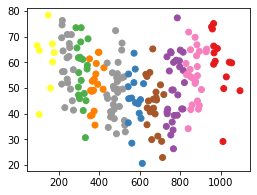
Raw Data
labels = fit_kmeans(df, 10)
plt.scatter(df['height'], df['weight'], c=labels, cmap='Set1');
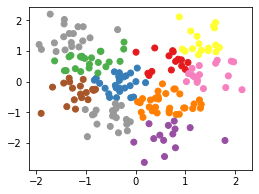
Standard Scalar
labels = fit_kmeans(df_ss, 10)
plt.scatter(df_ss['height'], df_ss['weight'], c=labels, cmap='Set1');
Min-Max
labels = fit_kmeans(df_mm, 10)
plt.scatter(df_mm['height'], df_mm['weight'], c=labels, cmap='Set1');
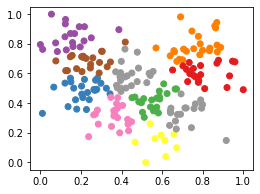
Scaling the data differently changes the groupings that KMeans generates. Note that this is because the KMeans algorithm is refit on each of the different datasets.
This example highlights the importance of always scaling data correctly BEFORE fitting KMeans, or any other model. And, remember that scaling data is required for any distance-based machine learning model.
This content is taken from notes I took while pursuing the Intro to Machine Learning with Pytorch nanodegree certification.