Clustering
One of the most popular unsupervised methods in machine learning is known as the K-means algorithm.
Use Cases
Clustering is used to group books and articles that are similar. This has helped to identify otherwise anonymous authors. It is also used to cluster movies and music in recommendation engines on Netflix or Spotify. Finally, it can also be used to cluster groups of customers to help identify similar groups of purchasers and thereby inform marketing efforts.
K-Means Mechanics
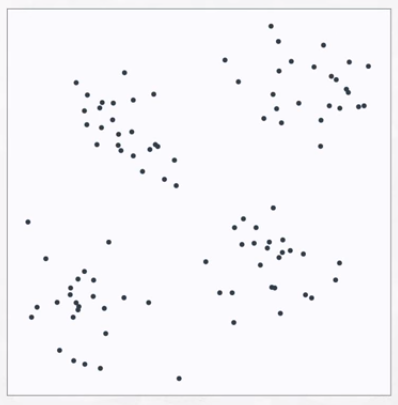
In the K-means algorithm, k represents the number of clusters in the dataset. In some cases, we can determine the correct number of clusters by a visual inspection of how the data is distributed. Reference the clustering examples post for some examples.
Often, the best number for k is not known based on either prior knowledge and is not apparent by visual inspection. This is generally the case for high-dimensional data, when visualizing clusters is not possible. In these situations, choosing the best k is both an art and a science.
Elbow Method
When k is unknown and cannot be easily determined, one common strategy for determining it is call the elbow method. This involves creating a plot of the number of clusters versus the average distance of the center of the cluster to each point.

This resulting plot is referred to as a scree plot. An example is shown below. The average distance decreases with each additional cluster. But with fewer clusters, those decreases will be larger. At some point, adding new clusters no longer creates a large decrease in the average distance. That point is known as the elbow.
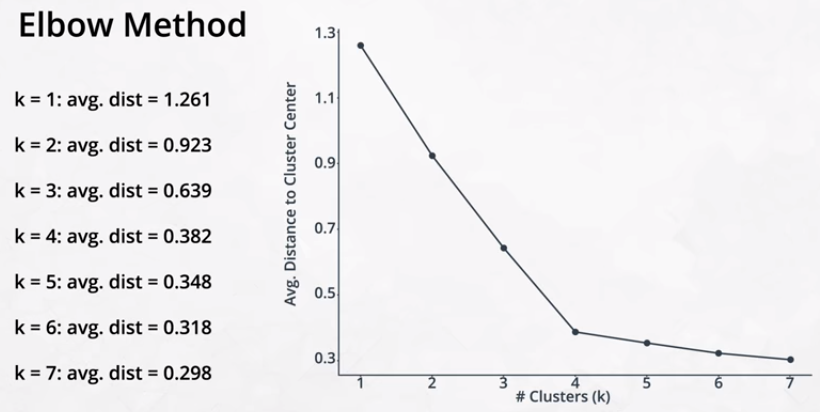
In practice, determining which point to consider the elbow is often a judgment call.
K-means Algorithm
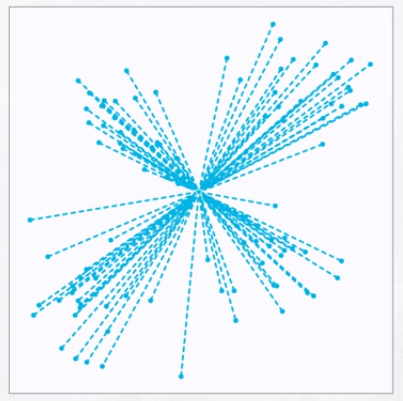
- Place k centroids randomly points onto the dataset.
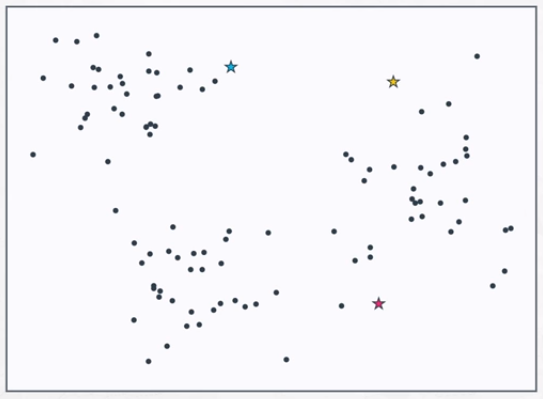
- Assign each point to the closest centroid.
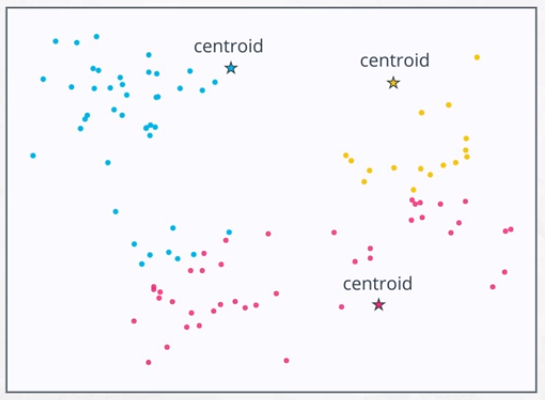
- Move the centroid to the center of the points assigned to it.
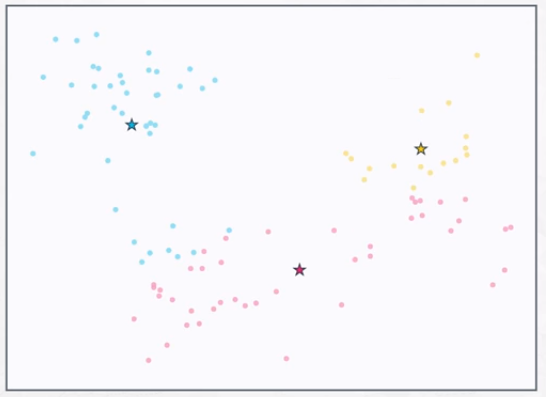
Repeat steps 2 and 3 until the centroids no longer move.
Notes on Algorithm
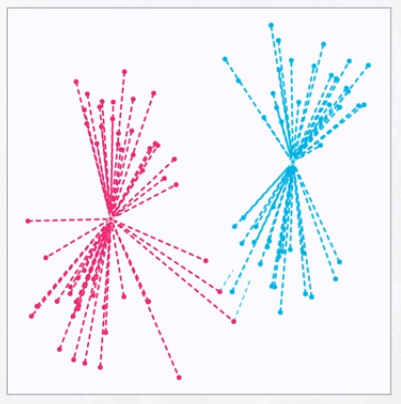
- Different datasets do not always lead to the same clustering of the data. The best way to make sure that the best grouping is selected is to run the k-means algorithm several times, each with different starting points. Scikit-Learn does this automatically. The best grouping is the one with the smallest average distance from the points to the centroids.
- Adding another centroid in k-means always results in a decrease of the averge distance from each point to the nearest centroid.
- There are several possible methods for choosing the ideal number of clusters, k, one of which is the elbow method.
Scaling Variables
Just like in Supervised Learning, K-means also requires feature scaling since it uses distances as part of its optimization. There are several ways that features can be scaled, but there are two that are most common:
- Normalizing or Min-Max Scaling: transforms variable values between 0 and 1.
- Used when scaling the coloring of an image.
- Standardizing or Z-Score Scaling: transforms variable values to have a mean of 0 and standard deviation of 1.
- Commonly used with clustering algorithms and with PCA and ICA.
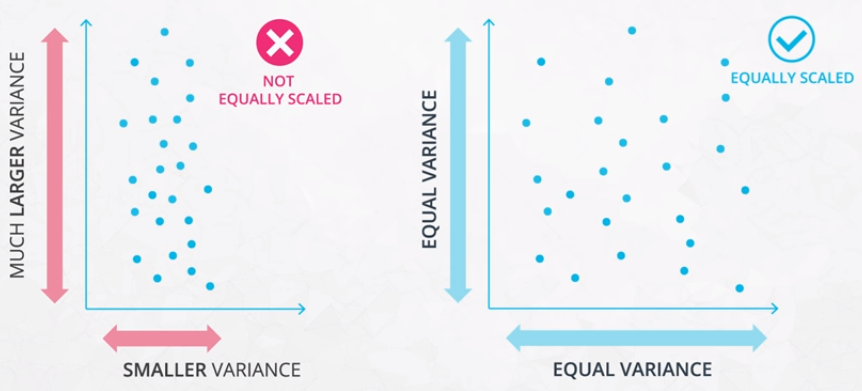
If features are not scaled, the features with much larger variance will dominate the importance in clustering.
Feature Scaling Example
As shown in the following example, depending on the scaling of the features, we can end up with 2 completely different clusters even though the underlying data is the same.
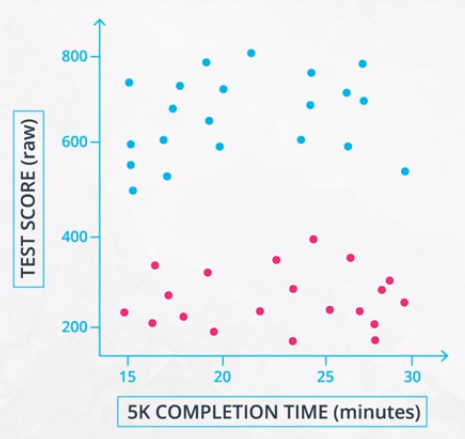
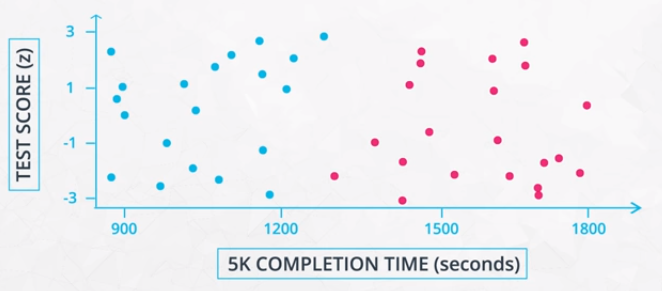
The result is that there are much different distances between points. For this reason, it is important to standardize data before clustering.
