Perceptron Implementations
Implementing the Perceptron Algorithm Using Numpy
%matplotlib inline
%config InlineBackend.figure_format = 'retina'

import numpy as np
np.random.seed(42)
import matplotlib.pyplot as plt
def stepFunction(t):
if t >= 0:
return 1
return 0def prediction(X, W, b):
return stepFunction((np.matmul(X,W)+b)[0])def perceptronStep(X, y, W, b, learn_rate = 0.01):
for i in range(len(X)):
y_hat = prediction(X[i],W,b)
if y[i]-y_hat == 1:
W[0] += X[i][0]*learn_rate
W[1] += X[i][1]*learn_rate
b += learn_rate
elif y[i]-y_hat == -1:
W[0] -= X[i][0]*learn_rate
W[1] -= X[i][1]*learn_rate
b -= learn_rate
return W, bdef trainPerceptronAlgorithm(X, y, learn_rate = 0.01, num_epochs = 40):
x_min, x_max = min(X.T[0]), max(X.T[0])
y_min, y_max = min(X.T[1]), max(X.T[1])
W = np.array(np.random.rand(2,1))
b = np.random.rand(1)[0] + x_max
boundary_lines = []
for i in range(num_epochs):
# In each epoch, we apply the perceptron step.
W, b = perceptronStep(X, y, W, b, learn_rate)
boundary_lines.append((-W[0]/W[1], -b/W[1]))
return boundary_linesdata = np.loadtxt('perceptron-implementations/data.csv',
delimiter = ',')
X = data[:,:-1]
y = data[:,-1]
lines = trainPerceptronAlgorithm(X, y)
print('Epoch :\t\tW\t\tB')
for n, line in enumerate(lines):
print('{}:\t\t{}\t\t{}'
.format(str(n+1).zfill(2),
round(line[0][0],3),
round(line[1][0],3)))
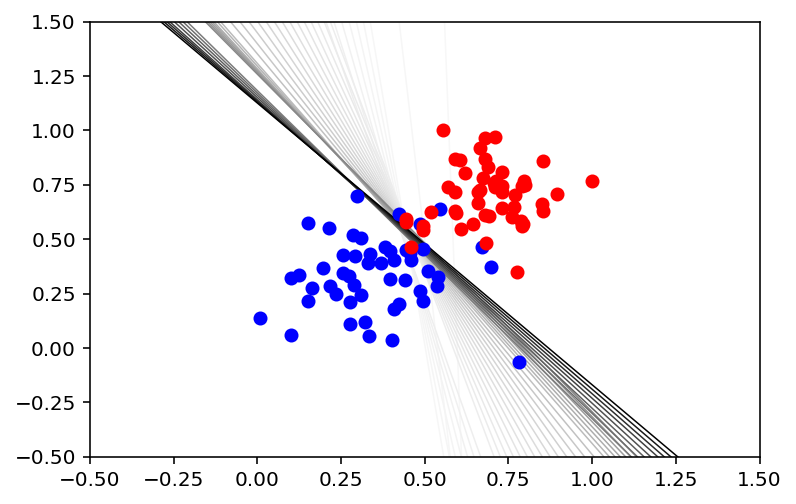
plt.figure()
X_min = X[:,:1].min()
X_max = X[:,:1].max()
counter = len(lines)
for w, b in lines:
counter -= 1
color = [1 - 0.91 ** counter for _ in range(3)]
plt.plot([X_min-0.5, X_max+0.5],
[(X_min-0.5) * w + b, (X_max+0.5) * w + b],
color=color,
linewidth=0.75)
plt.scatter(X[:50,:1],
X[:50,1:],
c = 'blue',
zorder=3)
plt.scatter(X[50:,:1],
X[50:,1:],
c = 'red',
zorder=3)
plt.gca().set_xlim([-0.5,1.5])
plt.gca().set_ylim([-0.5,1.5]);Epoch : W B
01: -0.052 -2.049
02: 1.238 -2.908
03: -39.477 23.579
04: -13.132 7.065
05: -9.116 4.575
06: -7.791 3.969
07: -6.775 3.505
08: -5.972 3.138
09: -5.321 2.841
10: -4.783 2.595
11: -4.331 2.388
12: -4.091 2.393
13: -3.803 2.259
14: -3.544 2.14
15: -3.312 2.032
16: -3.102 1.935
17: -2.911 1.847
18: -2.736 1.766
19: -2.577 1.692
20: -2.43 1.624
21: -2.294 1.561
22: -2.169 1.503
23: -2.052 1.449
24: -1.944 1.399
25: -1.843 1.352
26: -1.748 1.309
27: -1.708 1.296
28: -1.67 1.283
29: -1.64 1.277
30: -1.611 1.271
31: -1.582 1.265
32: -1.553 1.259
33: -1.509 1.184
34: -1.474 1.173
35: -1.44 1.162
36: -1.406 1.152
37: -1.373 1.141
38: -1.347 1.136
39: -1.321 1.131
40: -1.296 1.126
This content is taken from notes I took while pursuing the Intro to Machine Learning with Pytorch nanodegree certification.