Methodology 1: Analysis
Four Stages of the Methodology
1. Analysis
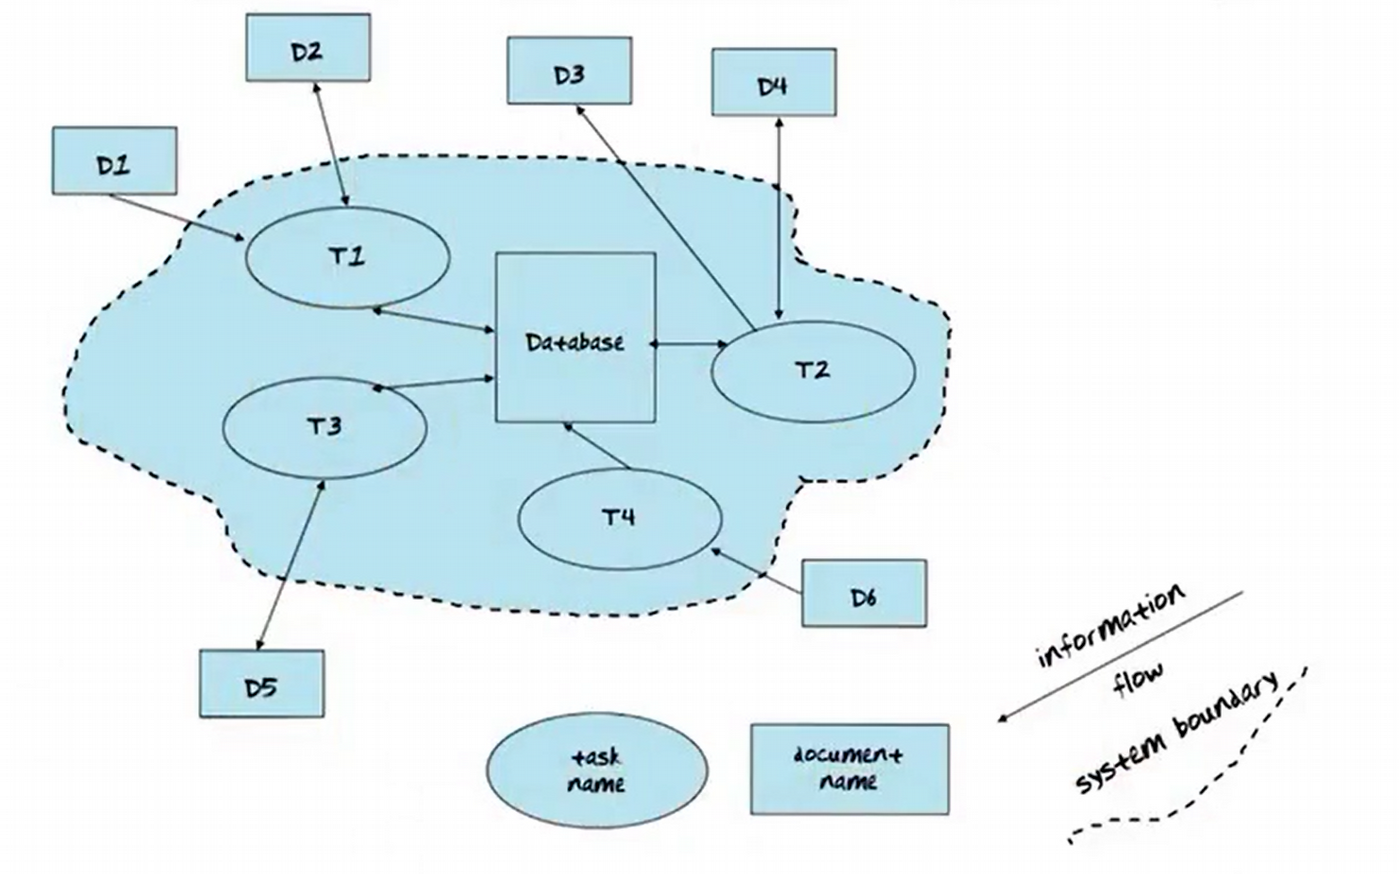
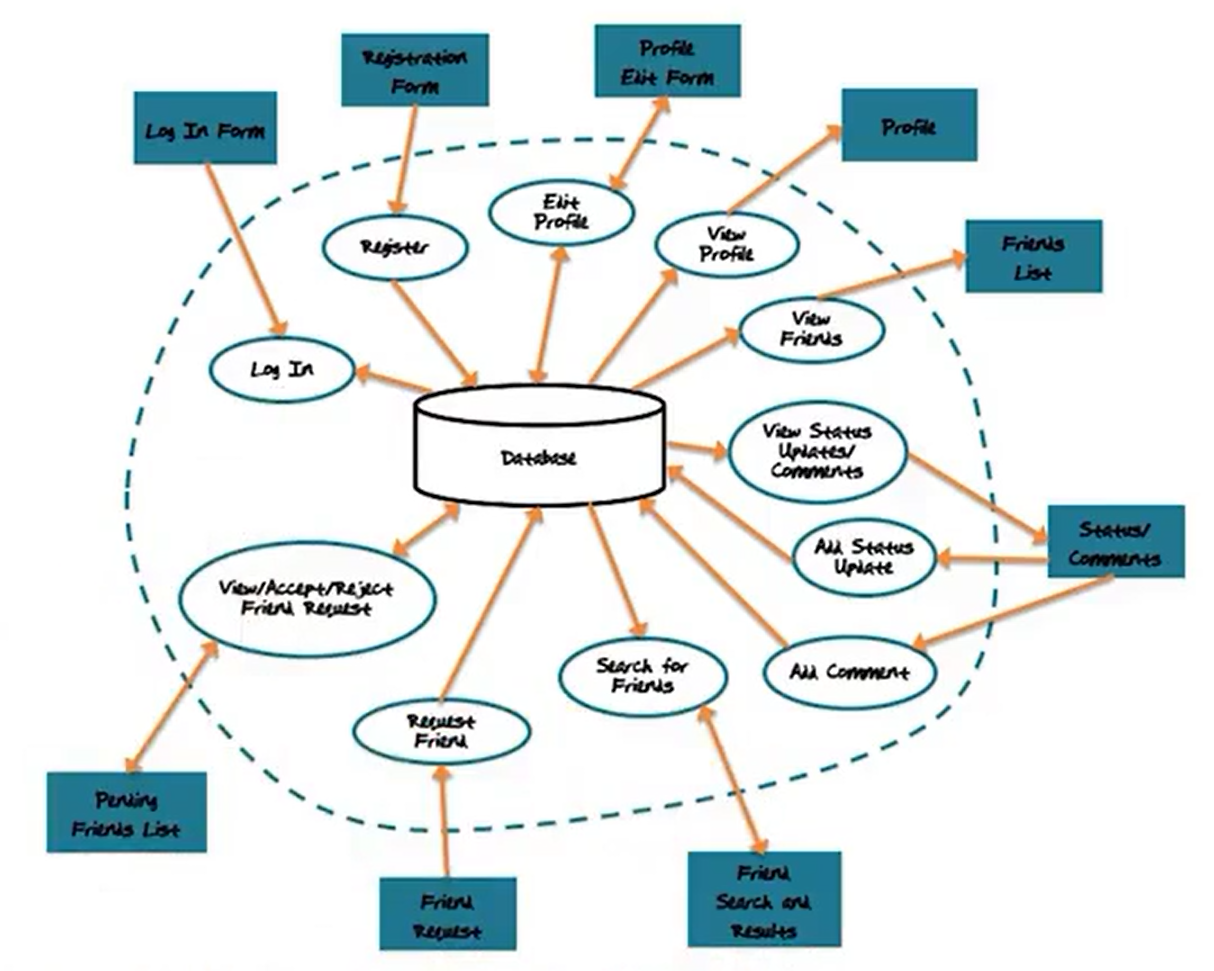
Output is the Information Flow Diagram
2. Specification
A. First step is to create an EER Diagram representing the data, then
B. Outlining the Tasks (or applications) that need to run on the database represented by the EER Diagram.
3. Design
A. Translate the EER Diagram to a Relational Schema, then
B. Convert the tasks that represent the actions that need to happen in the EER Diagram and represented them with Abstract Code.
4. Implementation
A. Use something like MySQL to create the Relational Database.
B. PHP Code is used with embedded SQL to rep

1. Analysis
- Information Flow Diagram – a first, high-level specification of the system. Not necessary to iteratively refine with the remaining steps in this methodology.
- Document Name – input and output screens.
- These seem to generally take the form of dialog boxes.
- Information Flow – potential information flow, not control flow.
- Bidirectional Arrows indicate input/output. Unidirectional Arrows indicate input or output.
- Never connect two documents.
- Never connect two tasks.
- Use document and task names from the project description in the IFD!
Example: Log In Form is an input to the Log In task. The Log In task reads from the Database to confirm that the combination of Email Address and Password is correct.
This content is taken from notes I took while taking the Database Systems Concepts and Design (CS 6400) course offered at Georgia Tech in the Spring, 2019 semester. The course content was created and presented by Dr. Leo Mark, an Associate Dean of Academic Programs and Student Affairs at Georgia Tech and Associate Professor in Georgia Tech's College of Computing.